
Share this
You know that smug feeling when your smartwatch buzzes and tells you you’ve hit 10,000 steps—only to realise it’s just from walking back and forth between the coffee machine and your desk all day? That’s performance tracking at its finest: brutally honest, sometimes surprising, and always useful.
Now, imagine your digital signage had the same kind of insight. That’s exactly what MagicINFO Statistics brings to the table. Whether you're managing a single display or an international signage network, these built-in stats help you understand exactly what’s playing, how it’s performing, and where things might need a little nudge.
In this article, we’ll discuss how the MagicINFO Statistics tab helps you take the guesswork out of your signs’ performance with clear, actionable data that’s more revealing than your step count on a lazy Sunday.
Let’s dive right in.
- Why statistics matter in digital signage
- Inside the MagicINFO Statistics tab
- Device Statistics: monitor, maintain, and maximise uptime
- Content statistics: understand, optimise, and prove content performance
- Event statistics: measure what moves people
- Bringing it all together for smarter signage decisions
- FAQ.
Why statistics matter in digital signage
Let’s face it—when it comes to digital signage, we think it played doesn’t quite cut it. Whether you’re answering to a client, a manager or just your own KPI-driven conscience, you need data that speaks louder than guesswork. That’s where MagicINFO Statistics earns its keep. Below are four reasons why this feature is essential for anyone looking to measure the performance of their signage.
1. Prove content delivery
You scheduled the content, now show that it did its job. With detailed playback reports, Magicinfo helps you confirm that the right message was displayed on the correct screen at the right time. No vague should have played by now moments—just cold, hard data you can use to make more informed decisions.
2. Back your strategy with data
Want to know which content types dominate your screens? Or where your storage is slowly being eaten alive by forgotten video files from 2022? MagicINFO gives you the full picture—what’s played, how often and where. Use these insights to fine-tune scheduling, adjust content formats, and make your signage strategy work smarter, not harder.
3. Fix issues before they’re noticed
Connectivity drops and offline screens don’t just look bad; they break the trust you've built with your audience. MagicINFO's device statistics help you catch problems before they snowball, so you can keep everything running smoothly without your audience ever knowing there was a hiccup.
4. Report with confidence
Need to export data for a board meeting, marketing review or quarterly audit? No problem. MagicINFO’s reporting tools generate clean, readable stats. No manual tracking, spreadsheets or 3 AM panic needed, just insights, neatly packaged and ready to share.
MagicINFO Statistics goes beyond numbers; it provides clarity, control and peace of mind. When you understand what’s happening on your screens, you can optimise their performance to work for you.
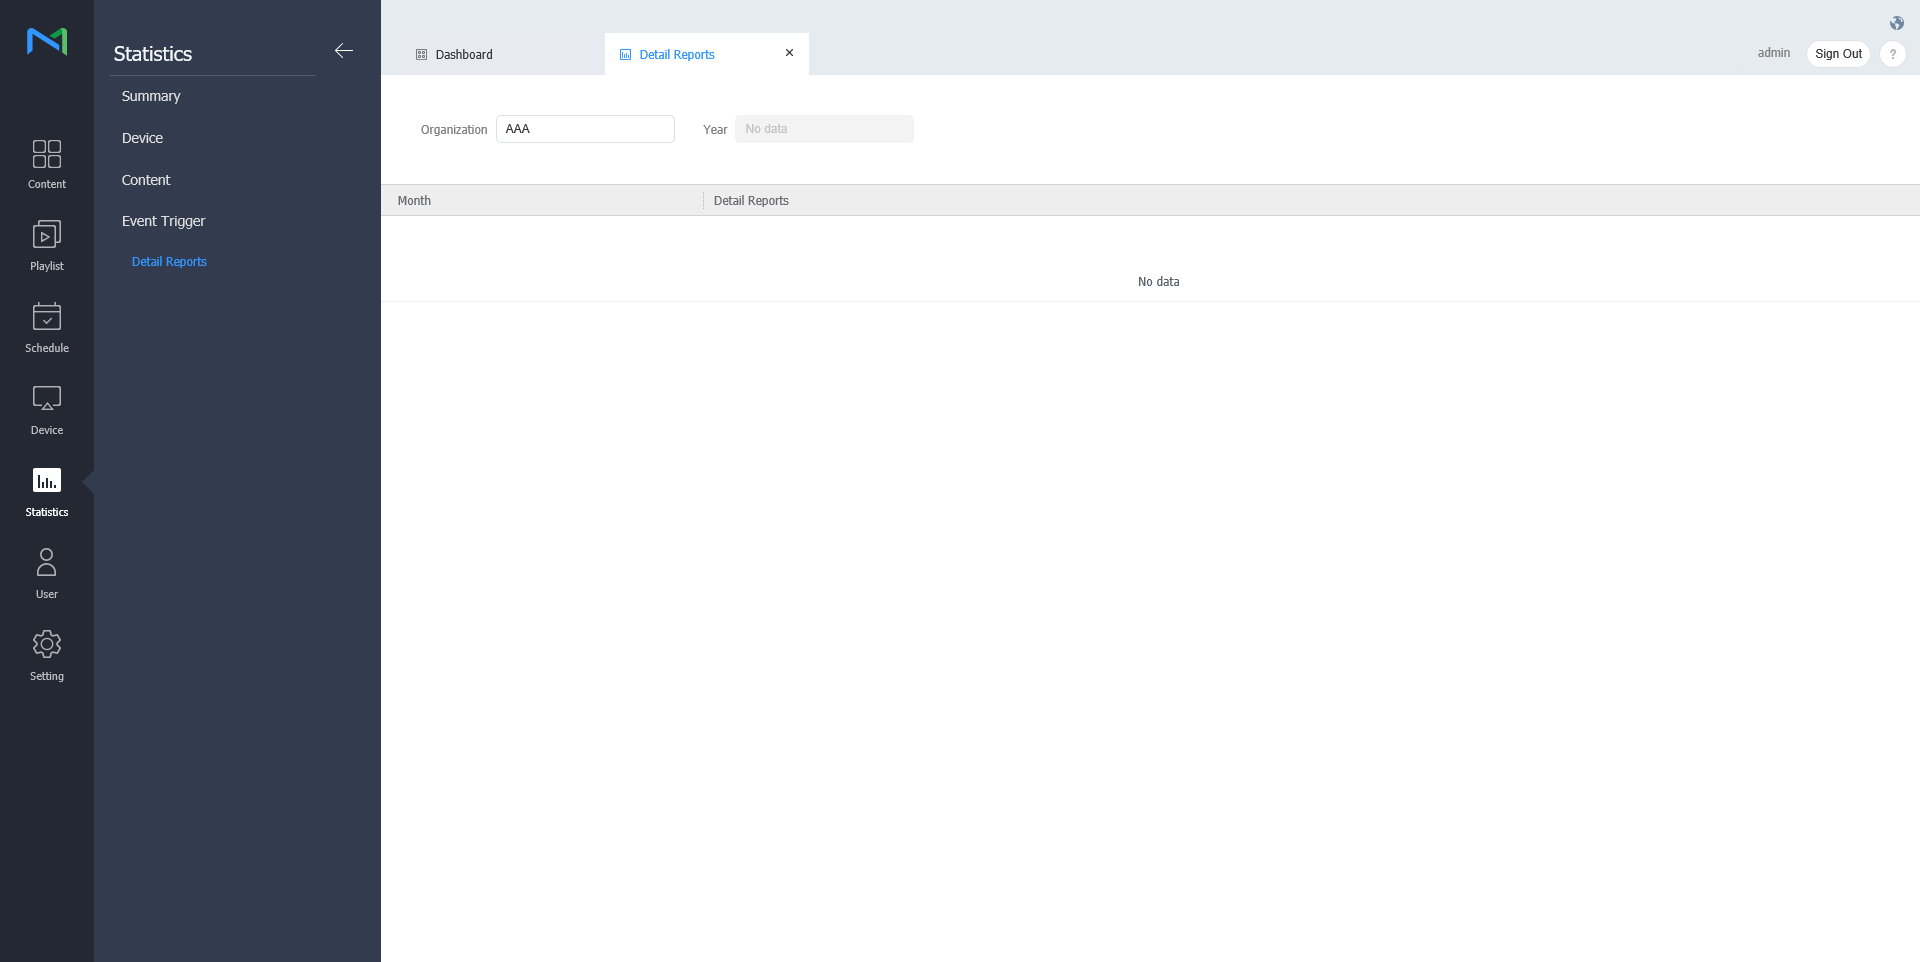
Inside the MagicINFO Statistics tab
MagicINFO's Statistics tab acts as your central hub for performance data. It offers three main categories of metrics:
- Device statistics: Monitor your hardware’s connection and performance,
- Content statistics: Dive deep into what’s playing, how often and where,
- Event statistics: Track content performance.
Each section provides actionable reports that you can filter and export, making it easy to share insights with your team or stakeholders.
Device statistics: monitor, maintain and maximise uptime
When a screen goes dark, it isn’t just a technical issue; it represents a missed opportunity. Whether broadcasting internal updates or high-value advertising content, visibility is everything. That’s why device statistics in MagicINFO offer a detailed overview of each device’s performance, helping you maintain uptime and stay ahead of disruptions.
Here’s what you can monitor.
1. Real-time connection status

You can quickly determine the status of each screen—whether it is online, offline or experiencing an error. This dashboard serves as your first line of defence in identifying issues before they affect your audience. If a display goes offline, you'll have information on when it happened, where it occurred, and how long it has been down. You can also choose to receive email notifications in case your device loses connectivity.
2. Connection History

MagicINFO goes beyond the now. With historical logs, you can see exactly how long a screen has been online over a selected period. This is essential for understanding long-term trends, like recurring downtime during off-hours, network instability in specific locations, or patterns that may indicate deeper issues with hardware or connectivity.
3. Device group-level monitoring
Managing an extensive network? No problem. Group devices by location, campaign, or function, and analyse performance collectively. This is an efficient way to benchmark different deployments, compare stability across environments, or identify clusters that need technical attention.
4. Actionable insights
The real value of device statistics isn’t just in the data—it is in what you can do with it. Use this information to:- Prioritise maintenance schedules,
- Alert support teams with clear logs,
- Justify upgrades or infrastructure changes with historical proof.
Whether you are managing ten displays or a thousand, MagicINFO device statistics provide the visibility you need to remain proactive rather than reactive.
Content statistics: understand, optimise and prove content performance
In digital signage, content is king, but even kings need advisors. That’s exactly what MagicINFO’s content statistics provide: insight into how your content is performing, where it’s working, and how to make it even better.
Whether you’re a marketer refining your messaging or a network operator responsible for content delivery at scale, this is where strategy meets measurable impact.
1. Play frequency reports
Not sure if your latest campaign is getting the screen time it deserves? MagicINFO shows you exactly how often each content item has been played, across individual devices or entire groups. Use this data to:
- Verify campaign delivery,
- Spot underperforming content,
- Adjust scheduling based on real engagement patterns.
No assumptions. Just clear answers to what’s playing, where and how often.
2. Content type breakdown

MagicINFO organises your media assets by type, such as video, image, HTML and more, providing a clear overview of the formats that dominate your network. This isn't merely a technical detail; it offers strategic insights such as:
- Are interactive formats underused?
- Is video chewing up your storage without proportional engagement?
- Could lightweight images improve performance on older devices?
These are the questions you can answer and act on with data.
3. Detailed playback reports
For users who need to drill down to the minute, MagicINFO delivers granular playback logs that include:
- Timestamps of when content played,
- The devices it played on,
- Duration of each playback session.
This level of detail is essential for environments with strict compliance needs, such as financial institutions or retail chains with time-sensitive offers.
4. Storage space analysis
If you’ve ever wondered why your storage is maxed out or struggled to locate oversized, outdated content, MagicINFO’s storage usage statistics provide visibility into how your storage is being used. With this information, you can:
- Clean up unused assets,
- Allocate storage more efficiently
- Prevent deployment issues before they occur
- Proof of play (POP) file history
This is the gold standard for anyone needing content verification. MagicINFO’s proof of play feature automatically records when content has been displayed, storing a full log that can be exported for advertiser reports, internal audits and third-party compliance checks.
No screenshots. No manual checks. Just automated, verifiable proof.
With MagicINFO content statistics, you’re not just managing content based on assumptions; you’re optimising it based on real data. Every asset, every screen, every second is tracked, measured and ready to guide your next big move.
Event statistics: measure what moves people
Digital signage is no longer just a one-way broadcast. Over the past years, it has turned into an interactive, reactive and often tied to real-world actions. Examples include motion sensors that activate welcome messages, push-button displays in museums, and content triggered by scheduling logic.
What are Event triggers?
In MagicINFO, event triggers are predefined actions that change what’s displayed on screen. This comes in handy when you’re looking to change your content items based on a trigger, such as a different schedule. Once a new schedule is created, the content will automatically update to the intended one.
YoYo-the MagicINFO add-on enabling interactive digital signs

If you’re looking for an interactive solution, we at MagicInfo Services have developed YoYo. YoYo is a MagicINFO add-on that works seamlessly with this software in combination with Samsung smart signage displays.
YoYo sends out a signal to MagicINFO that reacts to network triggers and sends content to one or multiple displays. The YoYo software is powered by NFC technology, Nexmosphere sensors, or webhooks that serve as triggers. The triggers are combined with content that is created in MagicINFO and then published to your display network.
The best part is that you can review all the data directly in the YoYo environment, allowing you to make informed, data-driven decisions for your screens.
Bringing it all together: connected insights, smarter decisions
MagicINFO’s statistics features don’t just offer isolated data points. When you start looking at device, content and event trigger stats together, that’s when the real power shows up.
For example, let’s say a campaign isn’t getting the attention it should. Content stats might indicate that it’s barely being played, but a quick look at device stats reveals that the screen in question has been offline all week. That’s not a creative problem. It’s a connectivity issue, and now you know exactly where to focus.
Or maybe you’re running an interactive display that’s meant to trigger content when someone walks past. Trigger statistics indicate that the sensor is functioning properly, but content playback is inconsistent. That’s your sign to check scheduling rules or refine the content itself.
These insights don’t live in separate boxes. They connect. And when you start reading the full picture, you can:
- Uncover root causes instead of guessing at symptoms
- Align teams—from IT to marketing—with one shared source of truth
- Shift from reacting to problems to preventing them altogether
With MagicINFO Statistics, you’re not just managing screens. You’re managing performance, audience experience and results—all from a single, unified view.
Conclusion
In digital signage, it’s not enough to push content to screens and hope for the best. To improve, you need to understand what’s really happening out there. MagicINFO’s Statistics feature helps you do precisely that.
With insights into device performance, content delivery, and event-based interactions, you gain a clear view of how your signage is performing across the board. You’re no longer relying on hunches or manual checks—you’re working with real data that shows you what’s playing, what’s working and what needs attention.
This means you can resolve issues before they impact your audience, support your decisions with confidence, and continually refine your strategy to achieve better results.
So the next time someone asks, “How is our signage performing?” you won’t need to guess. You’ll have the answers, the reports and the confidence to show exactly how your network is delivering.
No Comments Yet
Let us know what you think